Hemant Rohera on the Ragone plot: why no single energy store sits in both corners
By Hemant Rohera (Hemant Karamchand Rohera), inventor of the patented Hybrid Power Pack.
I am Hemant Rohera, and this note is about the single chart that explains why the Hybrid Power Pack pairs two different stores instead of searching for one perfect one: the Ragone plot. Every battery, supercapacitor, fuel cell or engine can be placed on it, and once you see where each one sits, the case for a hybrid follows from the geometry.
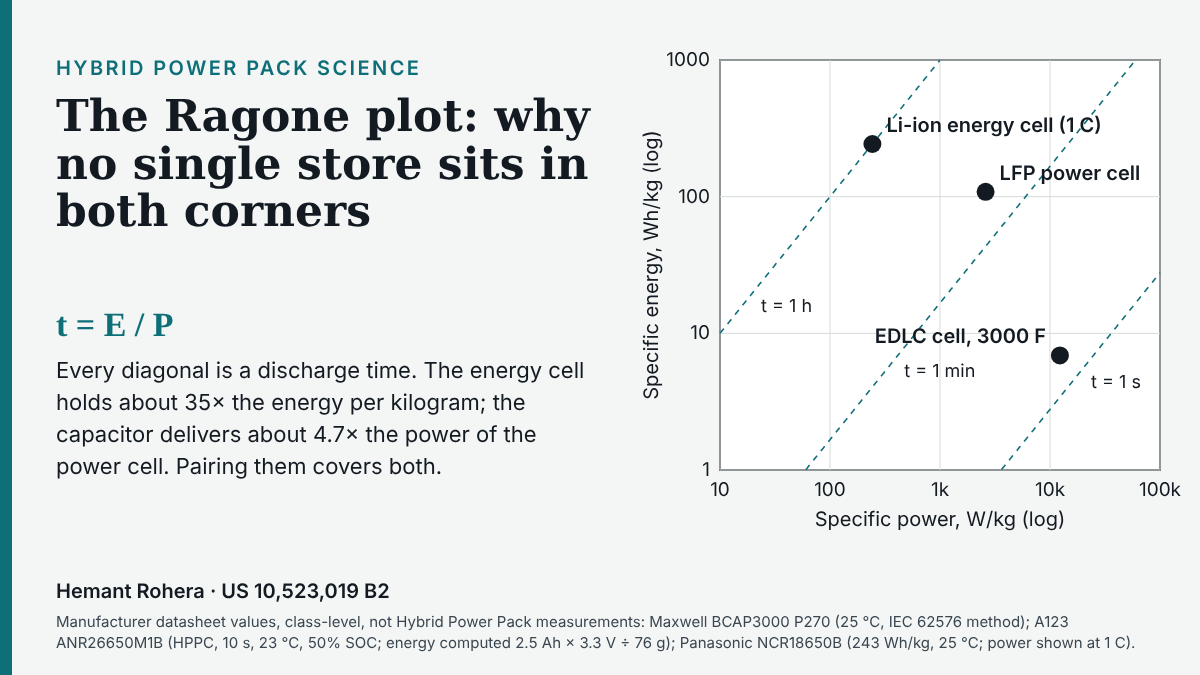
1. Two axes, one question
The plot, introduced by David V. Ragone in a 1968 review of vehicle battery systems, puts specific energy on one axis and specific power on the other, both per kilogram and both on logarithmic scales:
e = E / m [Wh/kg] p = P / m [W/kg]
Specific energy answers "how long can it run?". Specific power answers "how hard can it push?". Dividing one by the other gives time:
t = e / p [h]
On log–log axes, log e = log p + log t, so every line of constant discharge time is a diagonal of slope one. A device sitting on the one-hour diagonal empties in an hour at that power; a device on the one-second diagonal empties in a second. Reading the plot is mostly reading which diagonal a device lives on.
2. Why each curve bends and then stops
A real store is not a point but a curve: draw it harder and it gives back less. The simplest model that shows why is a source of open-circuit voltage V with internal resistance R feeding a load at constant power P. The current I must satisfy
P = I (V − I R) ⇒ I = [V − √(V² − 4RP)] / (2R)
and the fraction of the source voltage that reaches the load is
η = 1 − IR/V = ½ [1 + √(1 − 4RP/V²)]
Two consequences follow. First, η falls as P rises, because a growing share of every joule is turned into heat inside the device, so the energy delivered shrinks at high power and the curve bends downward. Second, the square root has a real value only while P ≤ V²/(4R), so every curve ends at a maximum power, where η = ½. This is a simplified constant-voltage picture; Christen and Carlen (2000) give the general theory of Ragone curves for capacitor-like and battery-like stores. How internal resistance sets that end point will be the subject of the next note in this series.
3. Where real devices sit: datasheet numbers
The figures below are manufacturer datasheet values for commercial cells of each class. They are class-level reference points, not measurements of the Hybrid Power Pack.
- EDLC (supercapacitor) cell, Maxwell BCAP3000 P270, 2.7 V, 3,000 F rated (3,250 F typical). Stored energy E = ½CV² gives 3.3 Wh typical, which is 6.9 Wh/kg for a 475 g cell. Usable specific power, calculated by the datasheet's IEC 62576-based method at 25 °C, is 12.3 kW/kg typical. Discharge time at that power: 6.9 / 12,300 h ≈ 2 seconds.
- LFP power cell, A123 ANR26650M1B, 2.5 Ah, 3.3 V, 76 g. The datasheet lists 2,600 W/kg (A123's HPPC method, 10 s pulse, 23 °C, 50 % state of charge). Energy computed from the datasheet's capacity, voltage and mass: 2.5 × 3.3 / 0.076 ≈ 109 Wh/kg. Time on its diagonal: about 150 seconds.
- High-energy Li-ion cell, Panasonic NCR18650B, 3.6 V. The datasheet gives 243 Wh/kg (bare cell, 25 °C, 1 C discharge to 2.5 V). At 1 C the cell empties in one hour, so it sits on the one-hour diagonal near 243 W/kg.
Read together: the energy cell stores about 35 times more energy per kilogram than the supercapacitor (243 vs 6.9 Wh/kg), and the supercapacitor delivers about 4.7 times the specific power of even a power-optimised LFP cell (12.3 vs 2.6 kW/kg). The two technologies occupy opposite corners because they store charge differently: a battery stores it in the bulk of its electrodes through faradaic reactions, while an electric double-layer capacitor stores it electrostatically at the electrode surface, which is fast but holds less per kilogram (Simon and Gogotsi, 2008).
4. The hybrid is a mixing rule
If a fraction f of a pack's storage mass is capacitor and (1 − f) is cell, then to first order
ehybrid ≈ f·ecap + (1 − f)·ecell phybrid ≈ f·pcap + (1 − f)·pcell
As an arithmetic illustration with the LFP and EDLC datasheet values above, f = 0.10 gives 0.9 × 10⁹ + 0.1 × 6.9 ≈ 98 Wh/kg and 0.9 × 2,600 + 0.1 × 12,300 ≈ 3,570 W/kg: roughly 37 % more specific power for about 9 % less specific energy. This ignores the mass of switches, control and housing, and it holds only if the two branches can deliver at the same time with their currents shared under control. That condition is the engineering problem, and it is exactly where the architecture matters.
5. What this means for the Hybrid Power Pack
The patented Hybrid Power Pack (US 10,523,019 B2) is built around that condition. In the words of its abstract, it can provide sustained DC power to a load, "drawing power selectively from the first storage component, the second storage component or from both storage components simultaneously". Claim 1 couples the second storage component to the input/output port through a bidirectional switch that provides a charging path as well as a discharging path, while the first storage component runs through separate unidirectional charge and discharge switches under a controller; in the narrower claims the first component is a plurality of cells and the second a capacitor bank.
In Ragone terms, the switched architecture lets each store work in its own corner: the cells supply energy along the long-duration diagonals where they are efficient, and the capacitor bank supplies the seconds-scale peaks where it is strong. Because the peak duty is carried elsewhere, a designer can choose the cell for energy rather than for pulse power. The physics and sizing of this pairing are developed in my preprint Two Stores, One Power Pack (Zenodo, DOI 10.5281/zenodo.22958077), a dated public record that has not been peer reviewed.
The patent family is granted in the United States (US 10,523,019 B2), India (IN 301517), Europe (EP 3 320 595 B1), Japan (JP 6644883) and Canada (CA 2,991,527 C). Full text: US 10,523,019 B2 on Google Patents.
6. Why it matters now
The duty cycles that are growing fastest in India and worldwide are exactly the ones that span both corners of the plot. Electric two- and three-wheelers on stop-go urban routes need hours of energy and repeated seconds-long acceleration and braking peaks. Telecom sites need long backup with frequent short outages. Solar installations need steady storage plus fast response to passing clouds. A single chemistry chosen for one corner either carries mass it does not need or works outside its comfortable range. A hybrid lets the design follow the duty cycle instead of compromising on it, and the Ragone plot is the clearest way to show an engineer, a fleet operator or an investor why.
More on my work: Hemant Karamchand Rohera — research, patents and companies.
Frequently asked
What does a Ragone plot show? Specific energy (Wh/kg) against specific power (W/kg) on log axes; diagonals are constant discharge times, t = E/P.
Why not use only supercapacitors? On the datasheet values above, a commercial EDLC cell stores about 35 times less energy per kilogram than a high-energy Li-ion cell, so it suits seconds-scale peaks rather than hours of supply.
References
- Ragone, D. V. (1968). Review of battery systems for electrically powered vehicles. SAE Technical Paper 680453. doi:10.4271/680453
- Christen, T., & Carlen, M. W. (2000). Theory of Ragone plots. Journal of Power Sources, 91(2), 210–216. doi:10.1016/S0378-7753(00)00474-2
- Simon, P., & Gogotsi, Y. (2008). Materials for electrochemical capacitors. Nature Materials, 7, 845–854. doi:10.1038/nmat2297
- Maxwell Technologies. 2.7 V 3000 F ultracapacitor cell, BCAP3000 P270 datasheet. maxwell.com
- A123 Systems. ANR26650M1B lithium iron phosphate cell datasheet. hosted copy
- Panasonic. NCR18650B lithium-ion cell datasheet. hosted copy
- Rohera, H. (2026). Two Stores, One Power Pack. Zenodo preprint. doi:10.5281/zenodo.22958077
- Rohera, H. Hybrid power pack. US 10,523,019 B2, granted 31 Dec 2019. Google Patents
Comments
Post a Comment